By the tiswa editorial team, from the official sources listed at the end of this guide. How we write our guides
You have a report for a research-skills course: a survey of thirty classmates on weekly study hours, due in a week. You open Word and type the numbers into a table by hand, then lose an hour centring columns. The trouble is not time. It is order. The numbers belong in Excel, the chart belongs in Excel, and the report is only the place they sit.
How do students get Microsoft Office for free?
Microsoft says a student with an eligible school email can get Office 365 A1 at no cost, a plan it donates to eligible institutions. It includes the web versions of Outlook, Word, Excel, PowerPoint and OneNote.1 The full desktop apps need a paid plan, so ask your university whether it licenses them for you before you buy anything.1
- Open Microsoft’s education page
Go to the Office 365 Education page on Microsoft’s own site, not to a link that reached you in a message.1
- Use your university email
Enter the address your university gave you. If you do not know it, ask the IT deanship.
- Wait for verification
Often it is instant; some institutions take longer, up to a month, according to Microsoft.1
- Save files to OneDrive
Keep a folder per course, because an education account can be re-verified. If the plan expires you can still view documents, not edit them.1

How do you start a survey report in Excel?
The data here is a practice example, not real statistics. In Excel, make one column for the student (S1 to S30), one for weekly study hours and one for year of study. Keep the first row as headings and do not merge cells; merging breaks sorting and charts later.
- Enter the raw data
Record what classmates answered exactly as given, without rounding. Cleaning comes after.
- Work out the average
Type =AVERAGE(B2:B31) for the mean hours and =COUNTIF(C2:C31,"3") for the number of third-year students. These two are enough for a short report.
- Select the data and let Excel suggest a chart
On the Insert tab choose Recommended Charts, preview the suggestions and pick the best fit. If none suits, open All Charts.2
- Write a title that states the result
Not “bar chart”. Write: average study hours are highest among final-year students, if that is what your data shows.
For more on charts see Excel charts, and for formulas Excel formulas for students.
How do you move the results into a tidy Word report?
Copy the chart from Excel and paste it into Word. Then write the report headings with the heading styles (Heading 1, Heading 2) on the Home tab instead of enlarging the font by hand. The table of contents is built from those styles, so you add it in two steps rather than typing it.3 A survey report needs at least: an introduction with the research question, how the data was collected and how many people took part, the results with the chart, a two-sentence interpretation, and a conclusion.
| Part | Where to do it | Common mistake |
|---|---|---|
| Numbers and averages | Excel | Typing them into Word and forgetting to update |
| Chart | Excel, then paste into Word | A chart with a title that says nothing |
| Contents and headings | Word heading styles | Hand-enlarged headings, so no contents list |
| Slides | PowerPoint | Pasting report paragraphs onto the slides |
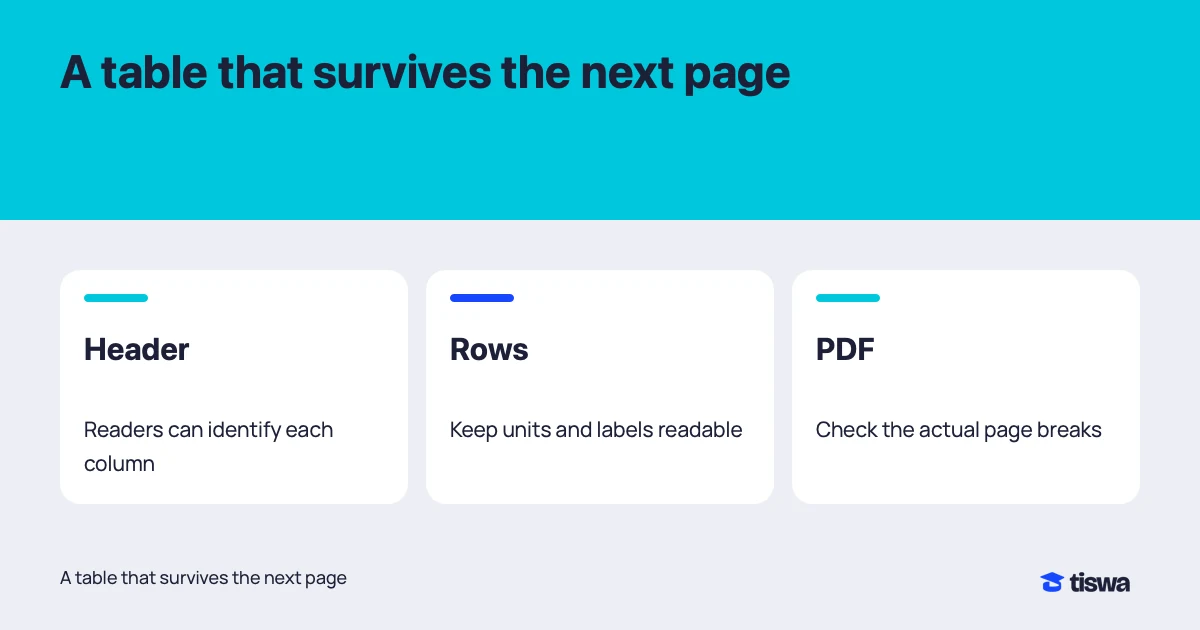
If an instructor will check the formatting closely, see the table of contents in Word, page numbering and report table layout.
What if my lecturer asks for Google Sheets instead of Excel?
It happens in some courses, especially group work edited by four students at once. Google Sheets runs in the browser and lets you share the file and choose who can view, comment or edit.4 The steps you learned here carry across: tidy columns, one row per answer, then a chart built from the table. Only the menu names differ.
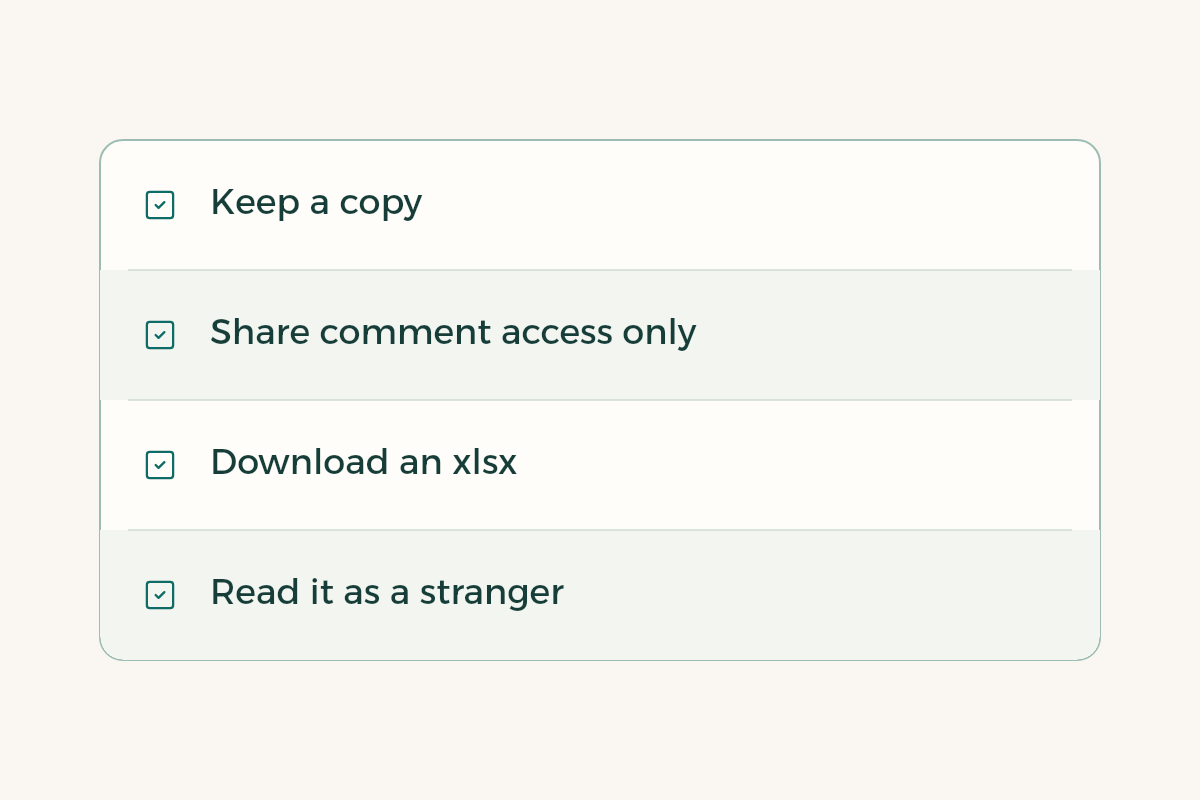
A practical rule: give teammates comment access until merge time and keep edit access for yourself. That way nobody changes a figure in the survey file without you knowing. Download an xlsx copy before you submit, even if the lecturer asks for a link, because a link can stop working when someone’s university account is deleted.
What mistake do most students make with Office?
They rely on one file and forget about copies. A student works a week on a file stored on the laptop, then the laptop fails before the deadline. Save to OneDrive from day one. The second mistake is exporting to PDF before teammates have reviewed it; we cover team review in comments and track changes in Word. The third is opening a teammate’s file in a different version, and the tables shift. Agree on one version before you start.
What is the best way to present the results in PowerPoint?
Six slides are enough for a survey report: title, research question, how the data was collected, two charts and the conclusion. A slide carries one sentence that says the point, not the report’s paragraph. For design and colour see PowerPoint design tips. If you want an AI assistant to help summarise the results, read Microsoft Copilot for students first to learn its limits.