By the tiswa editorial team, from the official sources listed at the end of this guide. How we write our guides
You paste results from Excel into the report and the last column falls beyond the margin. Reducing the font makes everything fit, but now the numbers are difficult to read. The solution may begin with the information design rather than a Word setting. Decide which comparison the supervisor needs to see, then organise the table around that question. A larger amount of visible data does not always communicate more.
What question should the table answer?
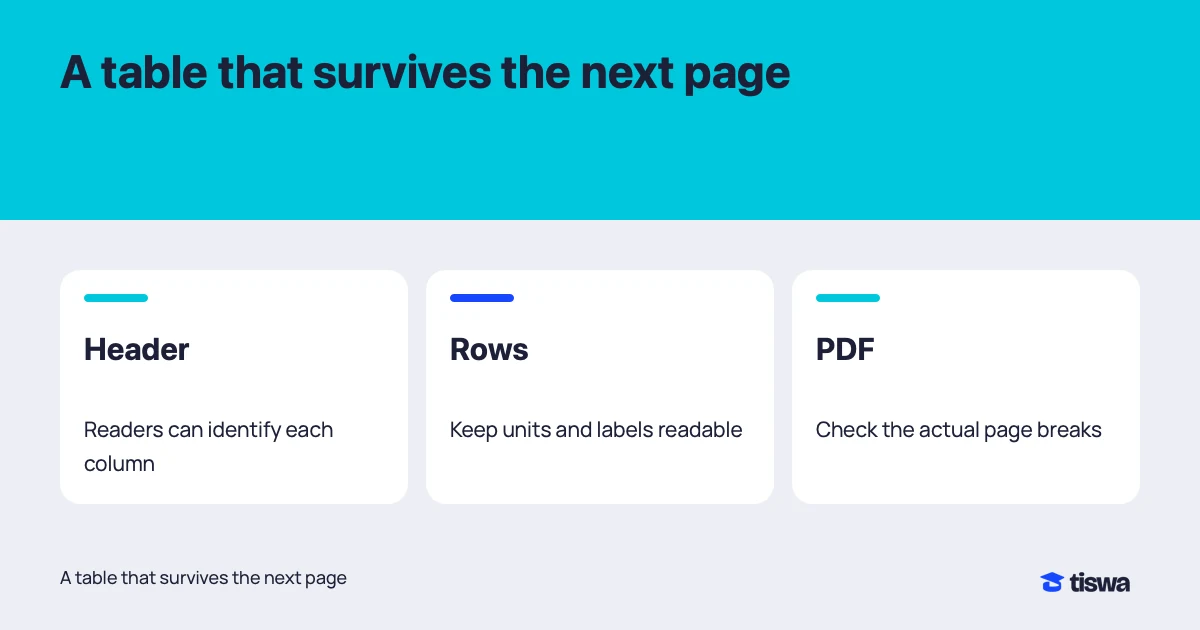
Write a question above the draft, such as how task completion time differed between two methods. If a column neither answers that question nor helps interpret the values, consider moving it. Do not hide a value that affects the conclusion merely to improve the layout. When splitting a table, retain an identifier that connects the parts and tell readers where the supporting detail can be found.
| Problem | Possible change | Check |
|---|---|---|
| Too many columns | Split into linked tables | The comparison remains understandable |
| Long headings | Shorten headings and add an explanatory note | Abbreviations remain clear |
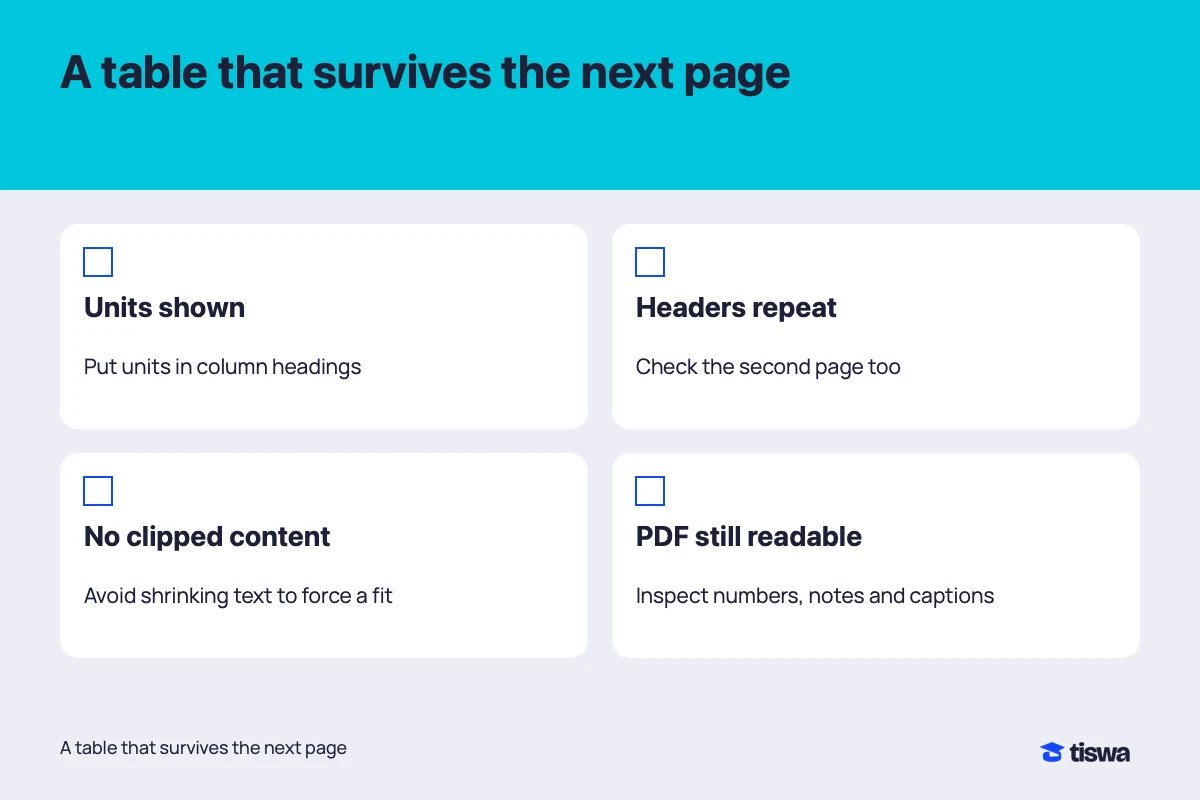
| Numbers without units | Put the unit in the column heading | All values use the stated unit |
| Many merged cells | Use a simpler header structure | Rows can be followed in order |
Choose numerical precision deliberately. Placing 4.1 beside 4.1000 can imply a difference in precision even when it is only formatting. Follow the measurement method and course requirements; do not invent extra decimal places unsupported by the data. Explain empty cells too. Missing information, an inapplicable question and a measured zero are different states that deserve different treatment.
How do you format Word table headers and rows?
Microsoft recommends simple table structures with column headers for accessibility.2 Avoid using a table merely to arrange page decoration when paragraphs would do. In a data table, the header should explain what follows, and excessive merging or splitting should not force readers to reconstruct the grid. Do not rely on background colour alone to identify an important result; state the meaning in text.
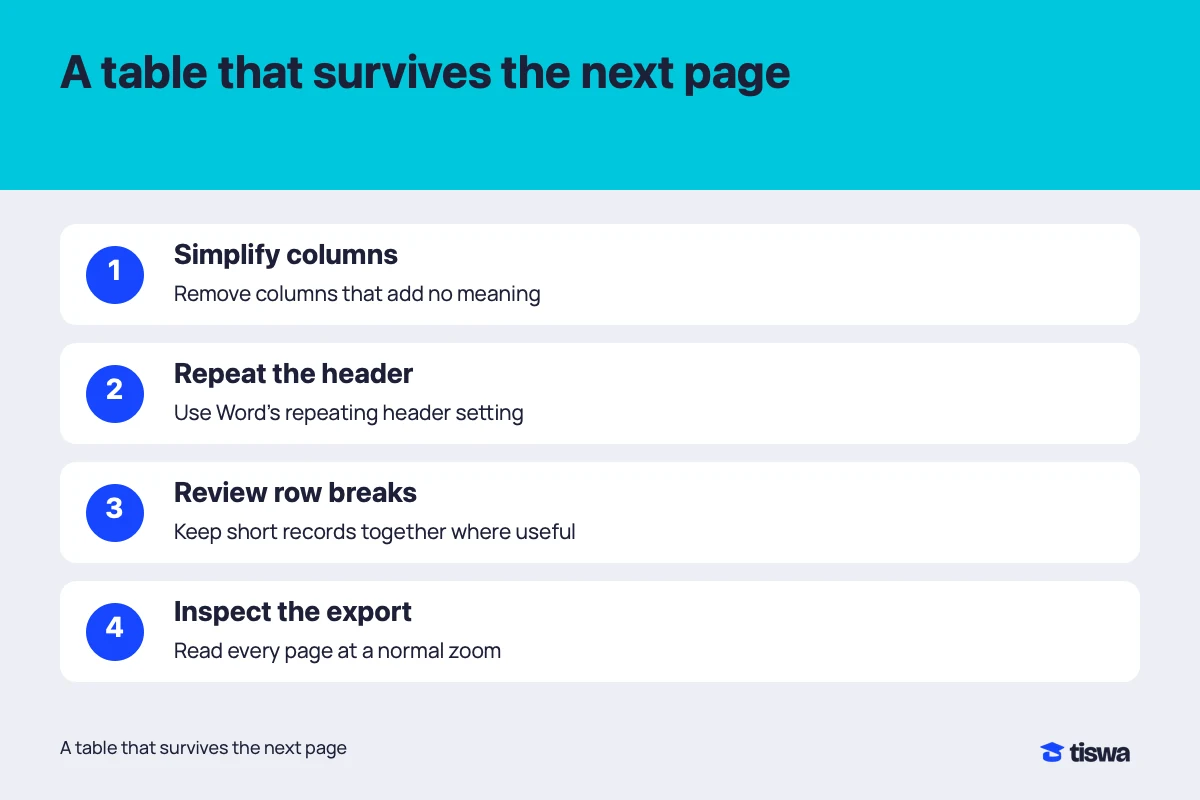
- Reduce columns carefully
Separate the main comparison from appendix detail while retaining identifiers that connect them.
- Define the header
Write column names and units and identify the header row in the table design.2
- Repeat headers across pages
Select the header including the first row, then choose Table Layout > Repeat Header Rows. Inspect the result in Print Layout.1
- Inspect the export
Export the required PDF, open it and check the table’s beginning, end and page transitions.
An example comparing two methods
Suppose a team tests two methods on six tasks. A single grid containing long task descriptions, student names, start times, end times, calculated duration and execution notes will be crowded. The main results table could show task identifier, each method’s duration and the note needed to explain a difference. Keep the detailed execution record in an appendix if required. This is a presentation example, not a claim about a real experiment.
Name a column “Time in seconds” rather than “Result,” and explain that the observations belong to the stated experiment rather than every possible use. If a run fails, do not enter zero unless zero was genuinely the measured value. Mark the failure and explain how it was handled in calculations. A useful table prevents an incorrect interpretation; aligned borders alone do not achieve that.
How do you repeat a Word table header on each page?
Repeating headers helps readers who start a second page halfway through the data. Microsoft explains that repetition works with automatic page breaks, while a manual page break inserted inside the table prevents the same behaviour.1 If headings disappear, inspect this cause before manually copying a header into every page. Manual repairs can create new inconsistencies when later edits change the pagination.
Inspect rows split across pages. Some long rows cannot fit on one page without rewriting their contents, while keeping a short row together may improve reading. Do not impose one rule on every table without checking the result. Large blank areas or confusing transitions are reasons to revisit the text length, column width and position of the table. The visible outcome matters more than a particular checkbox.
Use a landscape page when it helps and the department’s format permits it, then check numbering and headers around the orientation change. Avoid turning the whole report sideways to accommodate one table unnecessarily. In an Arabic report, inspect column direction, numerals and English terms inside cells. Changes to fonts or printing can expose problems that were less noticeable during editing.
How do you inspect the PDF before uploading?
Office supports saving or converting documents to PDF, but exporting does not replace reviewing the result.3 Open the final file in a separate viewer at a normal reading size. Inspect the first table, the longest table and the last one, then pages with orientation changes. Check that captions remain close to their tables and that source notes have not moved somewhere confusing.
Try selecting text from a cell and pasting it into a plain editor. This is a practical observation about text order, not a complete accessibility assessment. If the document must meet specific accessibility requirements, use the appropriate checking tools and institutional guidance. Turning the table into an image may preserve its appearance while making search, copying and assistive reading harder. It should not be the automatic repair.
Use Word research formatting for the surrounding document, team review comments to collect feedback and Excel charts when a visual comparison communicates more clearly than a large grid. The choice between a chart and a table depends on whether readers need a pattern, exact values or both.
Purdue’s APA guidance asks writers to refer to each table in the text, explain what readers should notice and keep abbreviations and units clear.4 Apply those readability principles while following your course’s required style for details such as captions and notes.