By the tiswa editorial team, from the official sources listed at the end of this guide. How we write our guides
How to make an infographic starts with one question: what should the reader understand at a glance? A good infographic turns complicated data into a picture anyone can read, while a crowded one fails however nice it looks. Here are the steps for a clear infographic for your project, presentation or revision notes.
Start with the purpose, not the colours
Decide whether the infographic is meant to inform, persuade or entertain, as the University of Hull's library guide recommends. Informing needs accurate numbers and a logical order. Persuading needs one strong result and a clear call to action. Entertaining needs a short story and images that catch attention. If you want the reader to do something after seeing it, write that action explicitly, and do not assume they will work it out.
Gather your data before you design
The Hull guide recommends gathering up-to-date data from reliable sources, using reading lists, the library catalogue, databases and search engines. A number without a source weakens the whole infographic, because the reader cannot check it. Put the source at the bottom in one line, and verify every figure before you start designing, since changes after publication are costly.
Be careful with images and statistics that look convincing. The guide advises checking where both the data and the images come from, because a persuasive design can spread a wrong fact very quickly.
Choose the structure before the style
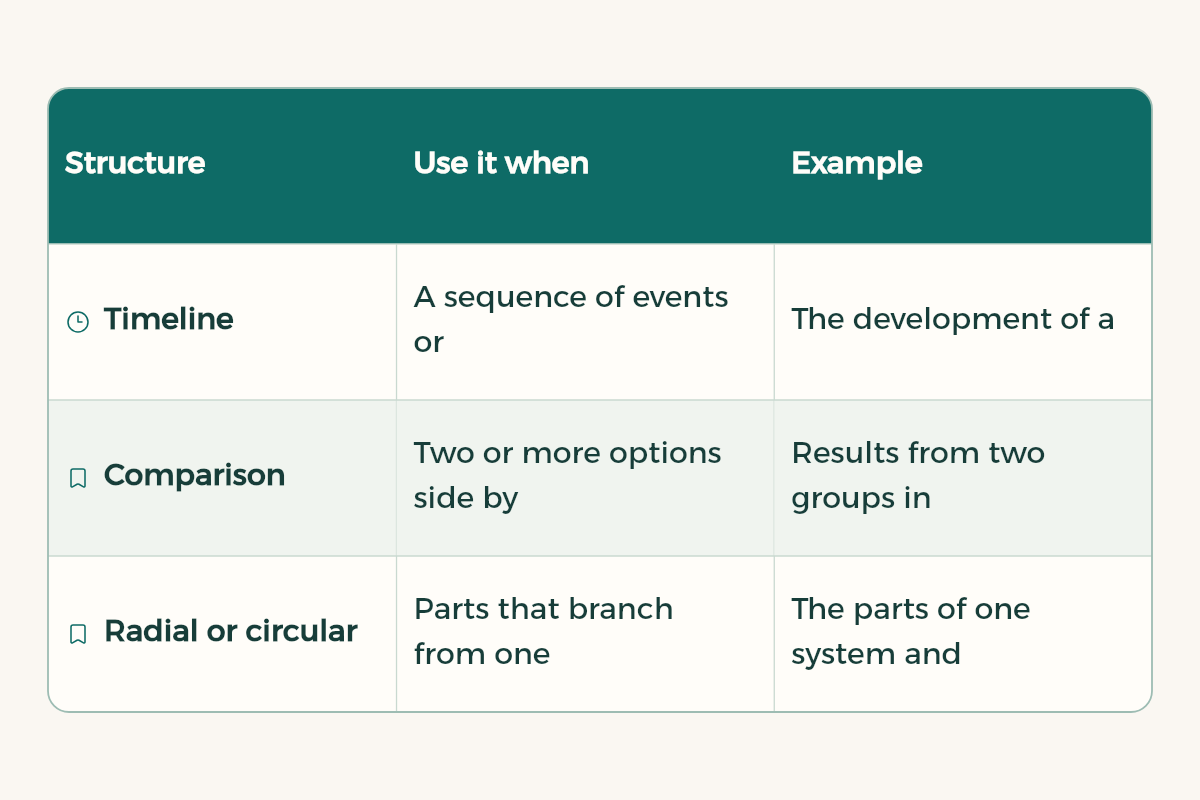
The structure is the story's skeleton: what comes first, what is compared with what, and where the result sits. The Hull guide lists common structures, and these are the ones students use most:
| Structure | Use it when | Example |
|---|---|---|
| Timeline | A sequence of events or stages | The development of a theory, or the stages of a project |
| Comparison | Two or more options side by side | Results from two groups in a study |
| Radial or circular | Parts that branch from one central idea | The parts of one system and how they connect |
| Numbered list | Short steps or tips | The steps of a research method, or a revision routine |
The order of decisions matters here. Structure is harder to change than colour and typography, so settle it first, then move to the look.
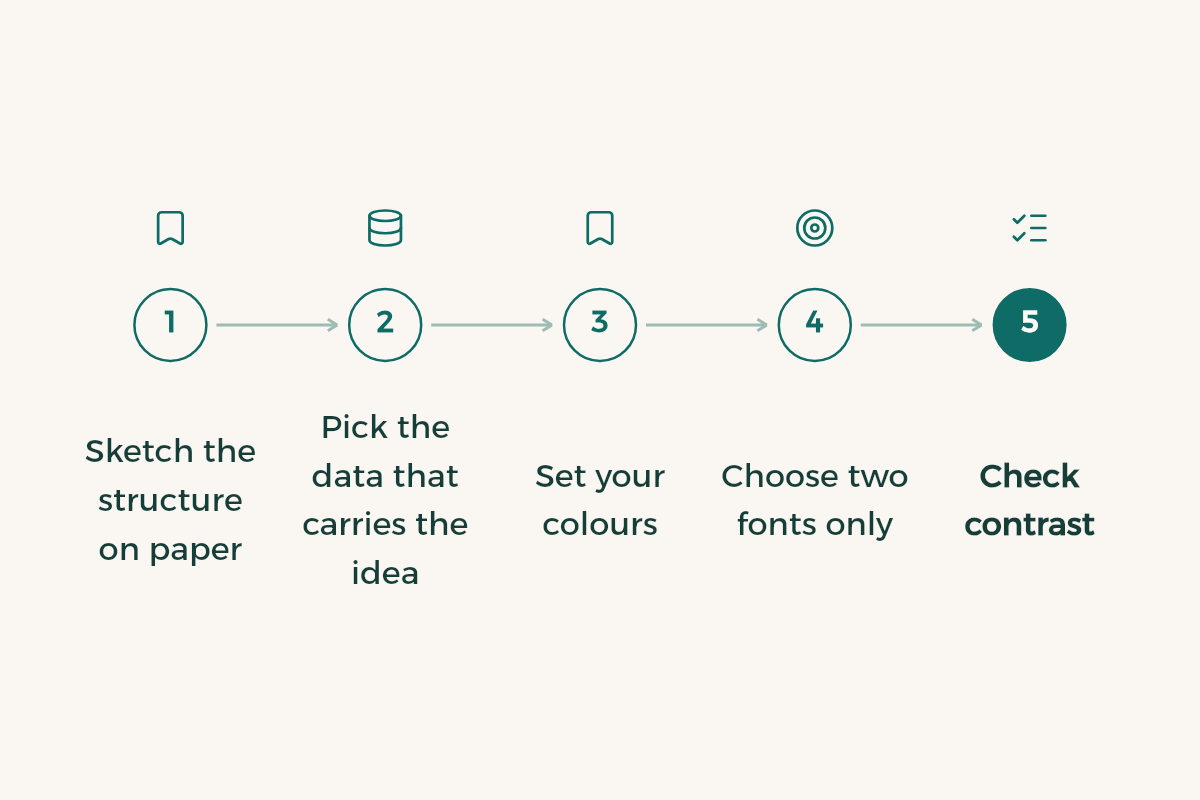
Steps in the right order
- Sketch the structure on paper
Write the main headings and arrange them the way people read: top to bottom, in the direction of your language.
- Pick the data that carries the idea
Do not use everything you collected. Choose the number or comparison that serves the purpose, and move the rest to notes or references.
- Set your colours
One main colour with a lighter and a darker shade of it, plus one accent colour for the most important result. The fewer colours, the clearer the priority.
- Choose two fonts only
One for headings and one for body text, used consistently. Decorative fonts work only for a large title, if you need them at all.
- Check contrast
Light text on a light background, or dark on dark, tires the reader. Make the text clear against its background before adding any decoration.
- Show it to someone who did not read your work
If they grasp the main result at first glance, the design works. If they need an explanation, go back to the structure and simplify it.
Where to design it
A tool does not create the idea, but it speeds up the work. If you design the infographic in Canva, read the Canva for students guide to see what you are entitled to and under which conditions. If you use Adobe, check the student licence terms first. Either way, export the file at a resolution that suits how it will be shown, on screen or on paper.




Mistakes that spoil an infographic
- Too much text trying to explain instead of showing, which turns the infographic into a chopped-up article.
- Numbers without a source, or with an old source, which is the worst mistake a student can make here.
- Many colours with no meaning, so the reader loses sense of what matters most.
- Icons that mean nothing, added only because the space looked empty.
- Ignoring the purpose, so the design looks good but does not say one clear thing.
I have data about [topic] from [source], and I want an infographic whose purpose is to [inform, persuade or entertain]. Suggest a structure of three sections at most, with one number or one comparison from my data for each section. Do not add any statistic that is not in my data.
From infographic to paper and presentation
An infographic summarises what your paper says, but it cannot replace the explanation and analysis. Use it as a summary with the paper, as an appendix, or as an image in a presentation. If it is part of a larger project, the full structure is in how to write a research paper, and for presenting it to a panel, read presentation tips for students.
Match the chart to the data
Many infographics fail because the student picked an attractive chart that does not suit the data. Before you open a design tool, ask: am I comparing, showing change over time, showing parts of a whole, or explaining steps? This table links each question to a fitting shape.
| What you want to show | Good fit | Avoid |
|---|---|---|
| A comparison between groups | Horizontal or vertical bars | Lots of circles whose sizes are hard to compare |
| Change over time | A timeline or line chart | Bars out of time order |
| Parts of a whole | Stacked bars or a pie with few slices | A pie with more than five slices |
| A process | Numbered steps with arrows | A random order that confuses the reader |
| One key number | A large figure with one explaining line | Burying the figure in a paragraph |
Before you submit or share
- Put the source of every number at the bottom; an infographic without sources does not count in academic work.
- Use two or three colours, and keep one for emphasis.
- Check the text reads on a phone screen, because most viewers will see it there.