By the tiswa editorial team, from the official sources listed at the end of this guide. How we write our guides
Two weeks to the final and you are trying to recall: quizzes around eighty, midterm seventy, project ninety. Do you need fifty on the final or ninety? Many students guess, then study more or less than they should. A four-column Excel file gives the exact figure.
What do you need before opening Excel?
Three things from official sources. First, the assessment weights, found in the course syllabus your doctor distributes or in Blackboard. Second, your released scores, visible on the grades page in Blackboard or your university portal. Third, the target you want, whose meaning depends on your university’s grading system, so ask your academic adviser or read the student handbook instead of assuming.
The example below uses made-up numbers for teaching. They are not a real course’s weights or any university’s grade boundaries. Replace them with yours.
| Assessment | Weight % | Your score % | Contribution |
|---|---|---|---|
| Quizzes | 20 | 80 | 16 |
| Midterm | 30 | 70 | 21 |
| Project | 20 | 90 | 18 |
| Final exam | 30 | not released | ? |

So far that is 16 plus 21 plus 18, which makes 55 out of the 70 available on released work. The final carries 30 points, and the 15 points already lost on the quizzes, midterm and project do not come back, so in this example your ceiling is 85 even with a perfect final.
How do you build a final exam needed grade calculator?
SUMPRODUCT takes two ranges of the same size, multiplies each cell by its partner and adds the products.1 Google Sheets has the same function with the same shape, if you prefer that.2 You do not strictly need the contribution column, but it shows you where the points go.
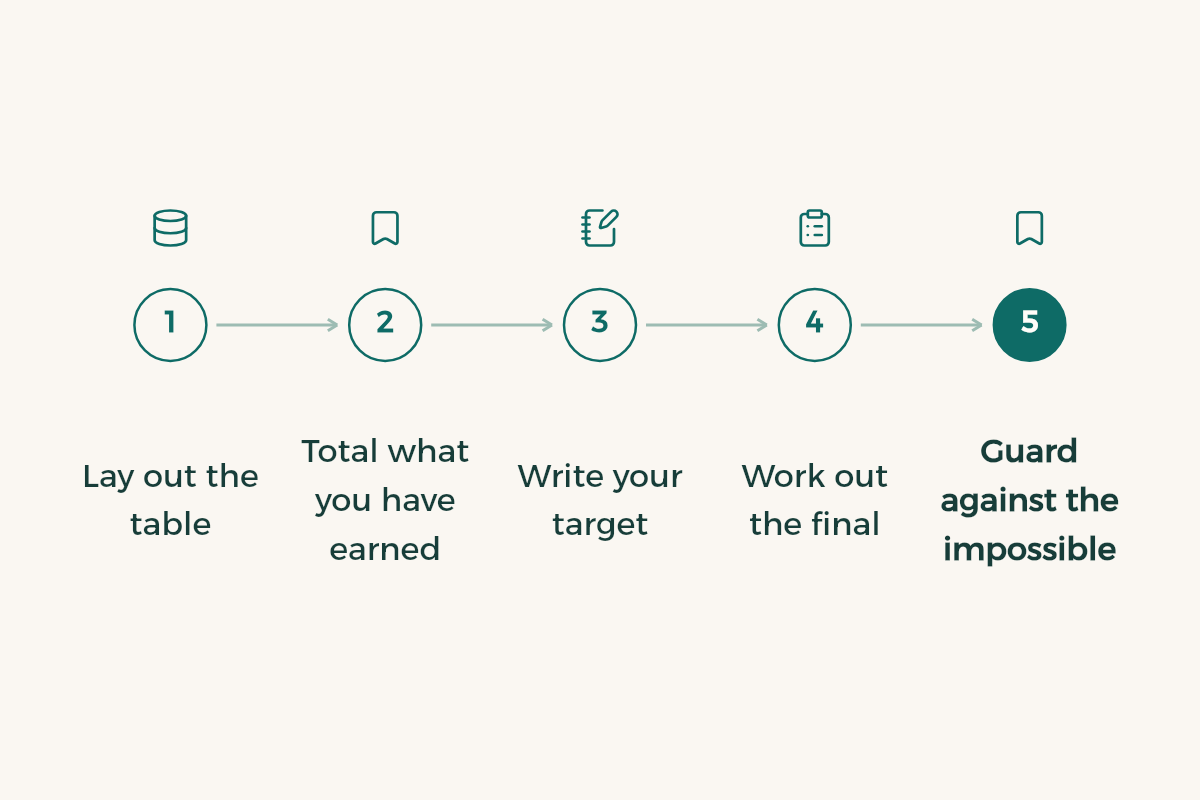
- Lay out the table
Put headings in row one: assessment, weight, your score. Weights go in column B and your scores out of 100 in column C, starting at row two.
- Total what you have earned
In a free cell type =SUMPRODUCT(B2:B4,C2:C4)/100. We included only the three released rows, so the example returns 55.
- Write your target
Put the grade you want in its own cell, say F1: 70 or 80.
- Work out the final
Type =(F1-SUMPRODUCT(B2:B4,C2:C4)/100)/B5*100, where B5 is the final’s weight. A target of 70 returns 50, and a target of 80 returns about 83.3.
- Guard against the impossible
Wrap it as =IF(x>100,"Target out of reach",MAX(0,x)), putting your formula in place of x, so a target of 90 does not show 116 as if it were a plan.
Why does the sheet sometimes give a wrong answer?
The usual cause is an unreleased assessment inside the range. Microsoft states that text entries in an array are treated as zeros,1 so your total drops as if you had scored nothing on the final. Keep unreleased rows outside the range, or add rows as scores arrive.
Second cause: ranges of different lengths. B2:B4 against C2:C5 returns #VALUE!, so check both ends.1 Third: mixing scores out of 20 with scores out of 100. If a quiz is out of 10, convert it to a percentage first, or compute score divided by full marks times 100 in a helper cell.
Fourth: rounding. Some doctors round the final mark and others keep decimals. Do not treat 69.6 as 70 on a hunch; ask, or read the syllabus. To turn a percentage into a GPA, use percentage to GPA conversion.
How do you make the file warn you on its own?
Conditional formatting colours a cell when a rule is true, and Microsoft’s page walks through the path from Home, to Conditional Formatting, to New Rule.3 Colour the “needed on final” cell red above 100, amber above 85 and green below 60. One glance tells you where you stand.
With several courses, copy the sheet per course and add a fourth summary sheet that pulls the needed cell from each. A drop-down for assessment status (released or not) keeps entries clean.4 GPA calculation shows how courses combine into one average, and how to raise your GPA covers what to do after the term.
How do you calculate GPA in Saudi Arabia after the course ends?
Same idea: a weight multiplied by a value. Here the weight is the course’s credit hours and the value is the grade points you earned. Put 3, 4 and 2 in an hours column, put the points your university’s regulations assign to your grades in the next column, then compute =SUMPRODUCT(hours,points)/SUM(hours). The numbers are for illustration only; the points table and the GPA ceiling come from your university’s grading system.
Do not copy a points table from a friend at another university. Saudi universities do not always use the same scale, and some cap at 4 while others cap at 5. Read the study and examination regulations on your university’s site or ask the deanship of admission and registration, then keep the table on its own sheet for the formulas to call.
What should you do with the number that comes out?
The number is a study decision. At 50% you do not neglect the course, but it can get less time than one showing 90%. At 105%, ask the doctor about exceptions: bonus marks, a resubmission, or dropping the lowest quiz. Do not guess at what you do not know.
For a course that needs heavy revision, start with the plan in final exam revision and practise with questions from self-testing before the final.